Seasonal RPM Drops: How to Bulletproof Your Ad Revenue in Q1

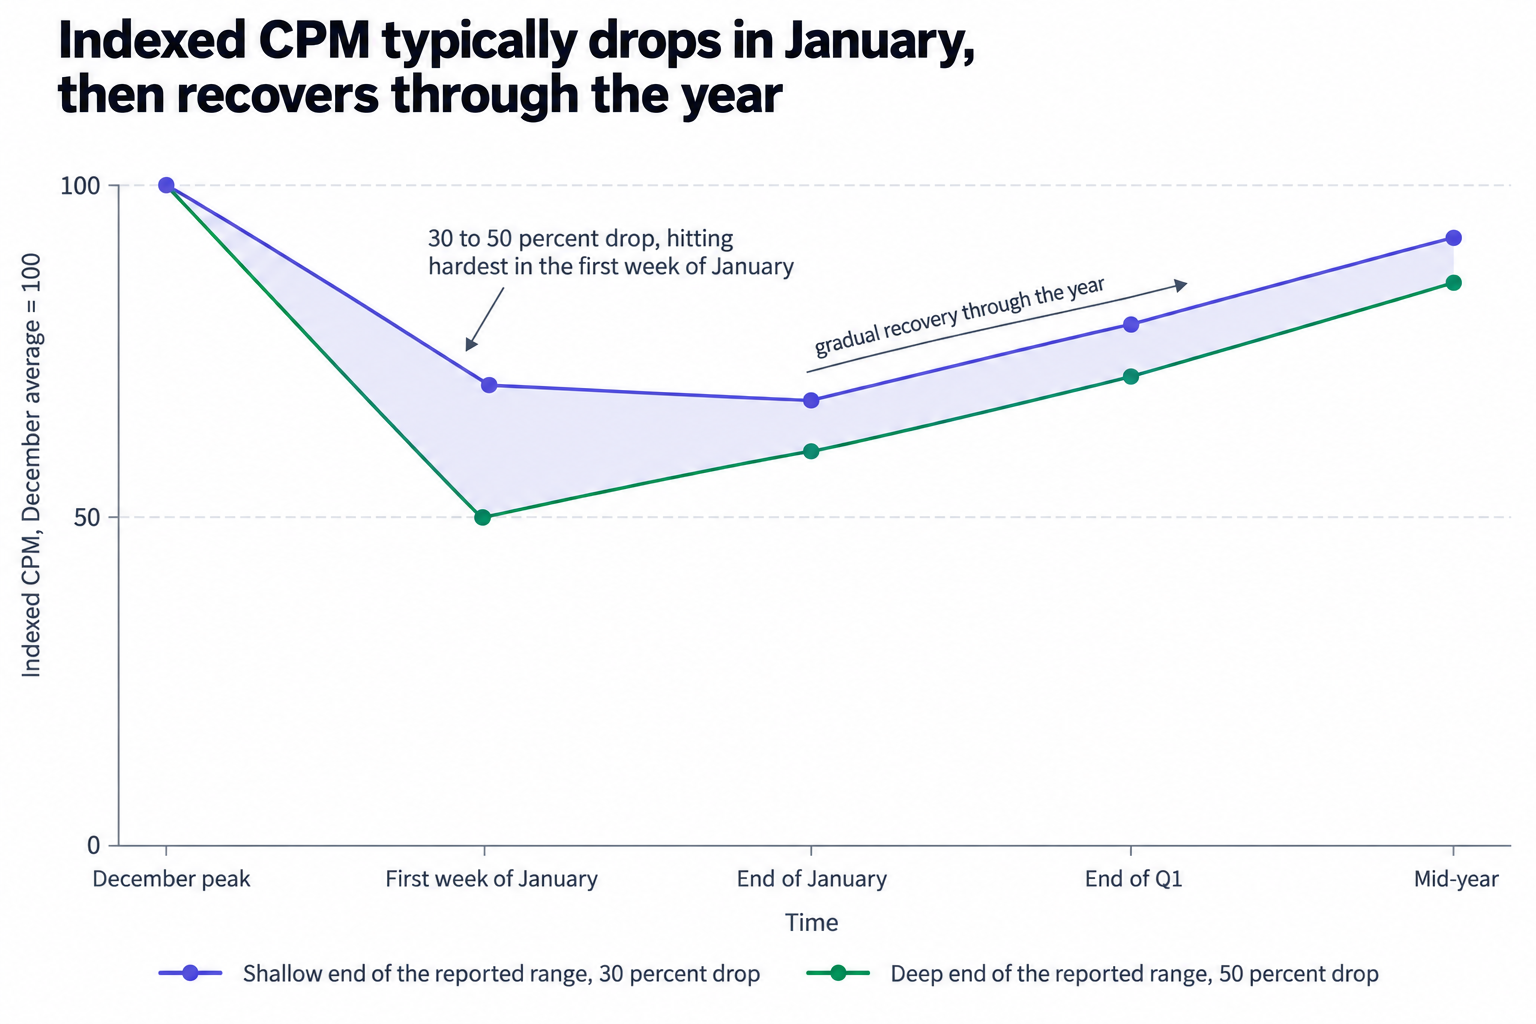
Q1 does not negotiate. Industry-reported practitioner analyses describe the pattern consistently: when traffic holds stable, ad revenue in RPM and CPM terms typically falls 30 to 50 percent from Q4 peaks, the drop clusters in the first week of January, and recovery arrives gradually through the year as advertisers exhaust their annual budgets. Nothing on your site broke between December 31 and January 2. The money that funded December bids did.
Treat the 30 to 50 percent corridor as a planning range rather than a measurement, because it comes from practitioner analyses rather than a named dataset. Index your December average CPM to 100 and the corridor places your first week of January between 70 and 50. That spread is real money at any scale, and preparation decides where in the range your inventory lands. Which is why this work starts in Q4, not in week one of the trough.
The cliff is mechanical
The Q4 peak does not reflect your inventory's true value, and the January trough does not reflect its failure. Both ends come from one mechanism: spend-it-or-lose-it year-end budgets produce aggressive bidding, and aggressive bidding produces a sharp CPM increase before the cliff. Practitioner analyses attribute the January decline to advertisers exhausting those same annual budgets.
Then the mechanism runs in reverse. Q1 insertion orders sit unsigned while pacing engines restart yearly targets at zero on January 1. The major demand-side platforms, The Trade Desk, DV360 and Amazon DSP among them, pace campaign delivery against flighted budgets, so a flight that ends on December 31 stops bidding on January 1 regardless of how your inventory performed. Buyers do not dislike your pages in January; the dollars that bid on them in December no longer exist, and header bidding transmits that fact within days. In a first-price auction every bidder shades its bid below its true ceiling, and shading stays disciplined only while enough competitors show up. Thin the auction and the shaded bids that lost all December start winning, so the clearing price falls with no change in your traffic, viewability or content.
The retail numbers behind the pullback
Advertisers pull back in January because purchase intent itself contracts, and the consumer data tracks it. National Retail Federation analysis of United States Census data shows retail sales fell 0.9 percent month over month in January 2025, seasonally adjusted, immediately after December increases of 0.7 percent month over month, while the same January came in up 4.2 percent unadjusted year over year. The holiday side was strong: 2024 holiday core retail sales grew 4 percent year over year. A year earlier, RSM US economists report that January 2024 retail sales fell 0.8 percent month over month, the first January drop since 2018.
The Q4 side of the ledger is genuine spending, not just budget mechanics. Consumers spent 76.8 billion dollars online in October 2023, 4.3 billion more than the prior year, per Adobe data that trade press cited. Performance buyers chase that spending, and they follow it out when it fades, which is why the first week of January takes the sharpest hit and the recovery arrives gradually instead of snapping back.
Two operational lessons sit in those figures. First, the January contraction is seasonal rather than structural: a month that fell 0.9 percent month over month still grew 4.2 percent year over year, so a January RPM that beats last January signals growth even while it embarrasses your December chart. Second, report the way the Census does, month-over-month seasonally adjusted next to year-over-year unadjusted. One frame shows the trough, the other shows the trend, and stakeholders who see only the trough demand structural surgery for a seasonal condition.
Diagnose before you change anything
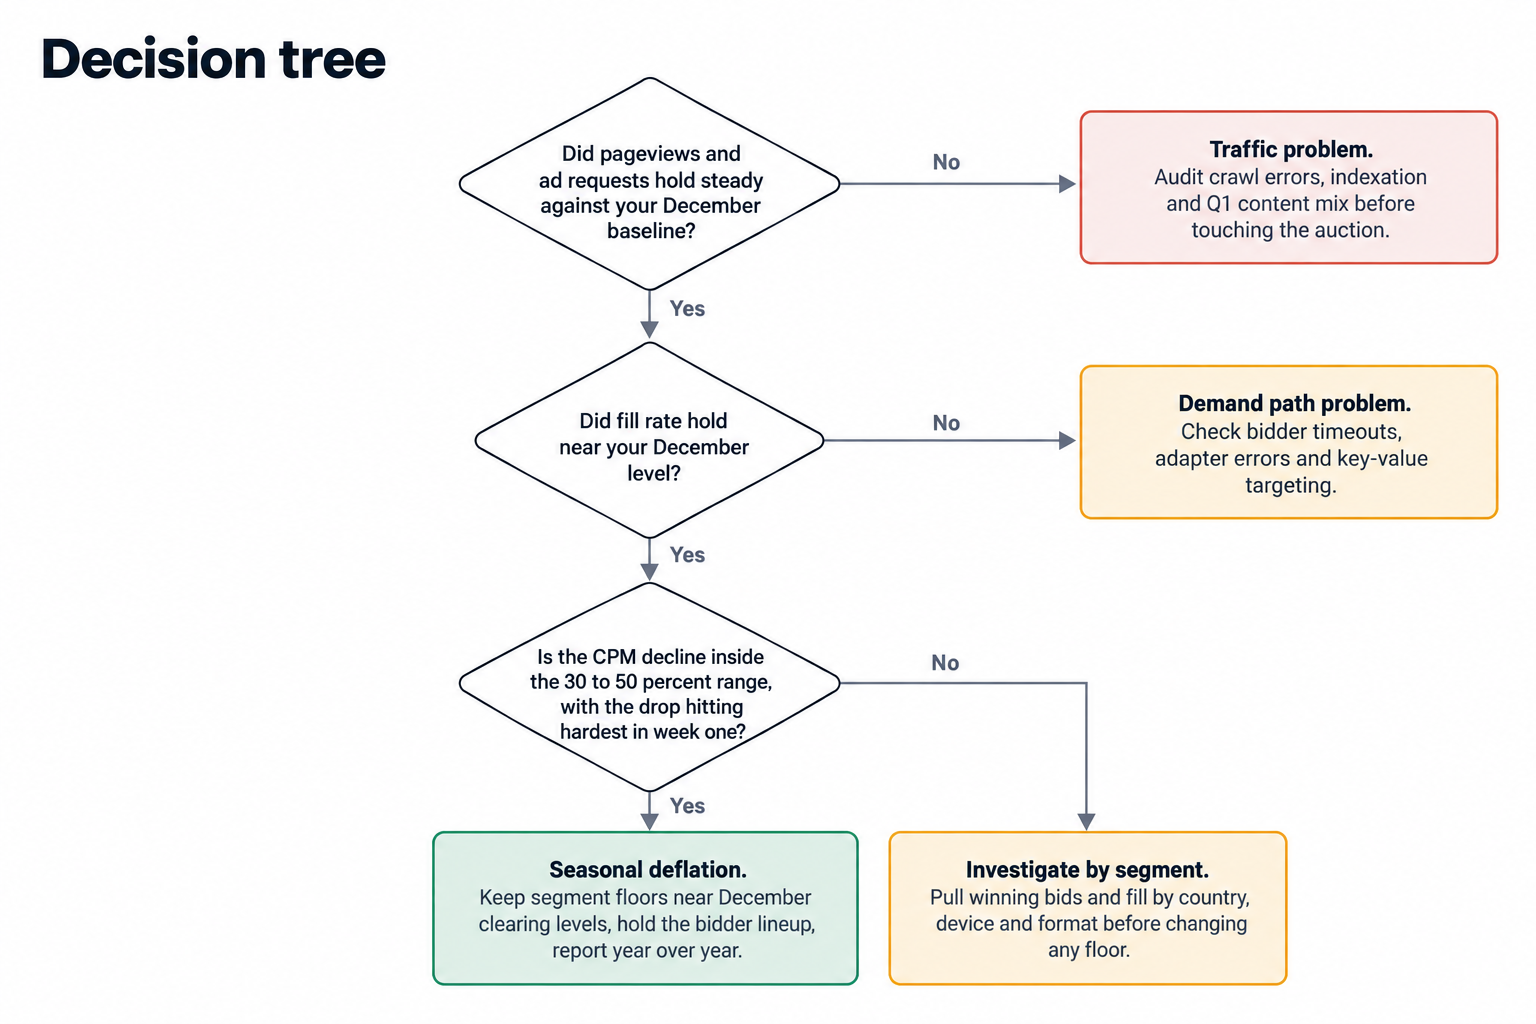
Seasonal deflation and genuine damage look identical in a revenue chart, and they need opposite treatments. Work through four checks in order before you touch a single setting.
- Rebase the comparison. January against December is a seasonality chart; January against last January is a performance chart. Pull both before you brief anyone.
- Verify the inputs. Hold pageviews, ad requests and impressions per page against both baselines. Stable inputs with a falling CPM point at the demand side; falling ad requests point at your stack or your content mix.
- Check fill before price. Fill that held while CPM fell means the same demand cleared cheaper, which is seasonality. Fill that collapsed alongside CPM signals a technical failure: bidder timeouts, adapter errors, broken key-value targeting.
- Split by segment. Country, device, format and page template each carry their own January curve, and the aggregate average hides the one segment with a real problem.
Your forecasting tools already know the shape of this curve. Google Ad Manager forecasting officially considers holidays and other yearly patterns: holiday seasonality predicts traffic changes around major holidays, and year-over-year seasonality detects patterns that repeat annually. The forecasting engine can automatically detect seasonal trends in traffic and apply them to future forecasts, and it needs 24 or more months of data to do so. That threshold is the practical constraint: if you switched ad servers or truncated your history inside the past two years, your Q1 forecast is blind, so export granular history now and keep it.
Live monitoring closes the loop during the event itself. Our reporting console refreshes CPM, fill rate, ad requests, pageviews, revenue, countries, devices and video detail every ten minutes, and API access lets you pull the same series into your own models. Build a baseline by weekday and hour for January specifically, and alert on deviations from the January baseline rather than from December's. An alarm you calibrate to December fires all January, trains the team to ignore it, and lets a real failure slip through during the season everyone watches.
Floors: the January lever publishers misuse most
The trough tempts two symmetrical mistakes. Teams chasing fill cut floors toward zero; teams that freeze leave December floors standing in a thinner auction. Both cost money, and the cost compounds through the recovery.
In a first-price auction with bid shading, your reserve price sets the lower bound of your clearing distribution, not a polite suggestion. When demand thins, shaded bids clear lower on their own, so a floor cut mostly transfers value: impressions that December competition priced correctly now clear at whatever the last serious bidder offers. Leaving December floors in place does the opposite damage: it prices out the buyers still transacting in week one, and fill falls on top of CPM. We document these mechanics, expected-value ranking, first-price bid shading and reserve strategy, in our guide to auction mechanics and reserve prices.
The fix is segment-level recalculation from data you already own. Pull the winning-bid distribution by country, device and format from December, mark the price levels where December fill stayed acceptable, and set January floors there rather than at the levels where December revenue peaked. Re-check every Monday through January, because a floor that fits week one goes stale by week four.
Thicken the auction in October, not in January
Demand density is the strongest lever you control, because it works on auction math rather than on negotiation. Every credible bidder you add raises the expected clearing price even when each individual bid shrinks in January, because the maximum of many shaded bids beats the maximum of a few. It is also the slowest lever: seat setup, deal negotiation and QA take weeks, so this work belongs in October and November, not in the trough.
Header wrappers cap out before the browser does, since every client-side bidder costs latency, so a January push to widen the wrapper degrades the page experience you need buyers to trust. Server-side seats solve the geometry by adding demand without adding client-side calls. We integrate OpenRTB 2.6 seats and Prebid for both header and server-side demand, and we filter which seats actually serve, because a wrapper full of bidders that never win is latency with no revenue attached.
Timing matters on the buy side too. Because we also run an agency, we watch buyers draft Q1 plans in November and December: pacing targets, budget allocations, package structures. Package and private marketplace deals that you negotiate before the holidays carry better terms than anything you sign in the trough, because they enter plans while the money still exists.
We are OnlyMedia: an ad network, an SSP and an agency in one company. Our curated programmatic demand network serves thousands of publishers, each above one million monthly pageviews, and we pay Net 30, CPM based, with no chasing and no sliding terms. The payment point matters in Q1 specifically, because seasonal revenue is lumpy enough without payment terms adding their own variance to your cash flow.
The levers outside the auction
Write the revenue equation out and the controllable levers appear: revenue equals pageviews times impressions per page times fill times CPM divided by 1,000. January sets the CPM term. You set the other three, and Q4 is when you set them.
- Traffic mix. Draft the Q1 editorial calendar in November. Search interest rotates in January toward finance, tax, health and travel booking, and content you publish in November has time to rank by the time the trough bottoms out.
- Impression depth. Audit lazy-load thresholds and refresh policies before the holidays. A threshold tuned for December engagement can quietly load fewer impressions in January sessions, which turns a market problem into a self-inflicted one.
- Session quality. Lower January CPMs make buyers pickier about viewability and page experience, so fix layout stability and ad density while you have slack to test, not while you firefight.
- Video. Video demand pools include brand campaigns that flight on quarterly schedules and do not all reset on January 1, so moving a share of impressions toward video cushions the trough without any negotiation.
None of these levers require the market to cooperate. They pay in every January, and they compound in the years when the trough runs deep.
Set the Q1 target in December
The worst Q1 goal is December revenue divided by three. It fails every year, it fails mechanically, and the team then treats a predictable season as underperformance. Set Q1 targets in December from the seasonal forecast: apply the 30 to 50 percent corridor to your Q4 baseline, adjust for the traffic plan, and write the year-over-year comparison into the goal itself, for example January revenue at or above last January with CPM inside the industry-reported seasonal range. A target you build that way survives the first week of the year without a single emergency meeting, and it gives the team a recovery curve to manage against instead of a cliff to explain.
Agencies advising publisher clients should anchor quarterly reviews to the same structure. Present the seasonal corridor, the year-over-year trend and the diagnosis tree together, and January stops undermining the annual story.
The Q4-to-Q1 calendar
The work splits cleanly by month, and every item has a deadline because the trough itself has one. Sequence the list against your own stack and assign owners in October, when a slipped week still costs nothing.
- October. Forecast Q1 with at least 24 months of history, extend the bidder lineup, start the Q1 editorial calendar, and turn on bid-level logging for the December peak. That distribution becomes your January floor sheet.
- November. Negotiate Q1 packages and private marketplace deals while buyers still hold unspent year-end budget and attention, then freeze wrapper changes and audit lazy-load thresholds.
- December. Capture segment baselines, document the winning-bid distributions, and hold the stack stable through the peak. Every December experiment you skip protects the baseline you will diagnose against.
- January, week one. Run the diagnosis checks, compare year over year, recalibrate floors by segment, and brief stakeholders with the seasonal frame before they see a bare month-over-month chart.
- January, weeks two to four. Re-check floors weekly against the recovery curve, watch fill for technical failures, and finish the QA you deferred in December.
The common thread matters more than any single item: nothing on this list can start in January and also finish in January. You build every protection for January revenue while December still bids.
Five recurring January mistakes
Every January produces the same five errors, and the framing above avoids all five.
- Reporting the December-to-January delta without the year-over-year frame. The Census structure, month-over-month seasonally adjusted next to year-over-year unadjusted, solves this in one table.
- Switching demand partners mid-trough. You will measure any partner you onboard in January at the seasonal low and credit it with a recovery it did not cause, so time the switch to Q2 and compare against the same months.
- Cutting floors to chase fill, which converts a market-wide demand problem into a permanent supply-side discount.
- Backfilling the trough with low-quality demand that damages layout stability and viewability, the exact metrics buyers price hardest during the recovery.
- Launching redesigns, migrations or structural experiments in January, when seasonal noise distorts every test.
All five are reactions. The calendar above replaces reaction with sequence, and it costs one planning session in the quarter when you have time for it.
Make the payment side boring
The last piece is cash flow. Net 30, CPM based terms turn the trough into a number you can plan around: you know what January earned before March, with no sliding terms to model. Terms that stretch to net 60 or net 90 in exchange for headline rates cost more in Q1 than they pay all year, because a long float stacked on a 30 to 50 percent revenue decline strains exactly the wrong month.
If you want a number before you commit to any of this, send your inventory profile and we will return a revenue estimate by email. The 30 to 50 percent corridor is the market's decision. How deep it bites your inventory, and how fast you climb out, is yours.