Yield Management 101: Moving Beyond Basic CPM Tracking
A CPM report tells you what an impression earned. It says nothing about what the impression could have earned, and that gap is the whole discipline of yield management. A property can post a healthy average CPM while leaking money in three places at once: ad requests that return no ad, floors that clear below what buyers would have paid, and partner bids reported gross while your payout math runs on net. Moving past basic tracking means finding those leaks, pricing them, and closing them on a schedule.
The denominator problem
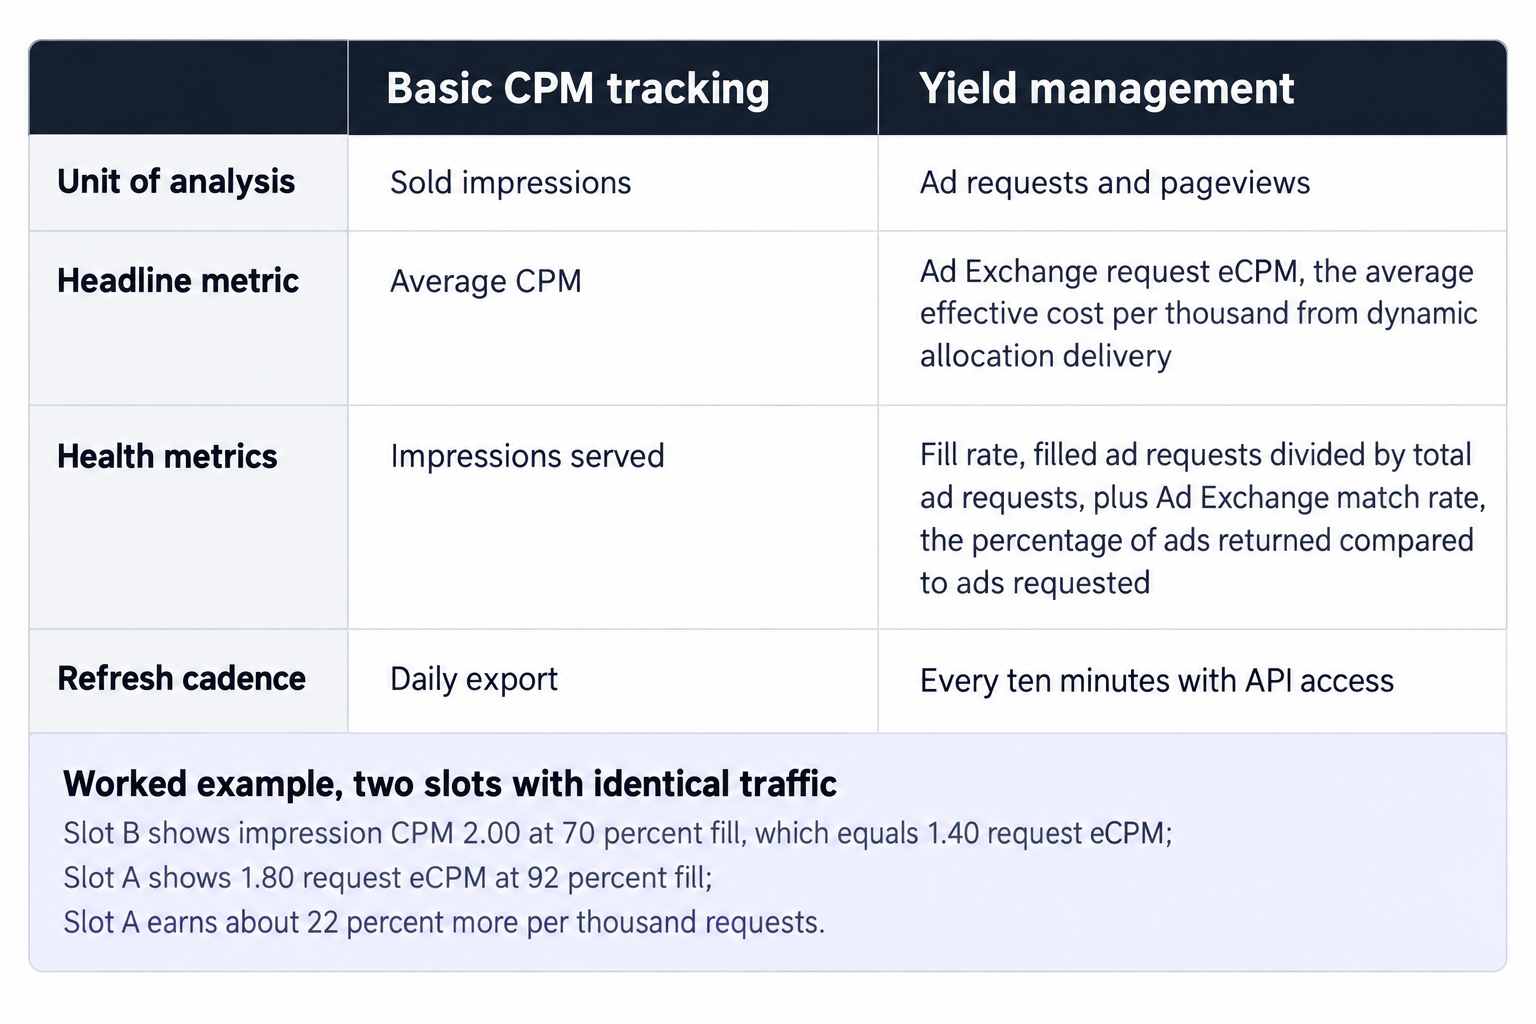
Basic tracking scores revenue per thousand sold impressions. The honest unit is the ad request, because every unfilled request consumed a pageview you already paid to acquire. Google's metric definitions draw the line precisely: fill rate equals filled ad requests divided by total ad requests, while Ad Exchange match rate measures the percentage of ads returned compared to ads requested. Match rate describes what Ad Exchange returned against what you sent it. Fill rate describes the ad server's outcome across every request it made, including the ones where no partner cleared.
The price side has its own metric: Ad Exchange request eCPM, the average effective cost per thousand from dynamic allocation delivery. Because the denominator is requests rather than served impressions, request eCPM already absorbs your fill losses. A slot can hold a strong impression CPM and still earn badly per request, and request eCPM is the metric that will say so.
Take two hypothetical slots with identical traffic. Slot B reports the better impression CPM, 2.00 on 70 percent fill, which puts its request eCPM at 1.40. Slot A reports 1.80 request eCPM on 92 percent fill. Per thousand requests, slot A earns 1.80 and slot B earns 1.40, so the headline CPM leader earns about 22 percent less money on the same audience. That inversion is the first thing yield management catches and the last thing an impression-level report surfaces.
One level up sits revenue per pageview: request eCPM multiplied by ad requests per pageview. Two slots per page is a choice, six is a choice, and both choices trade fill and viewability against request volume. Publishers past a million monthly pageviews feel this trade acutely, because every incremental slot monetizes the weakest screen positions first.
Dynamic allocation prices your own inventory
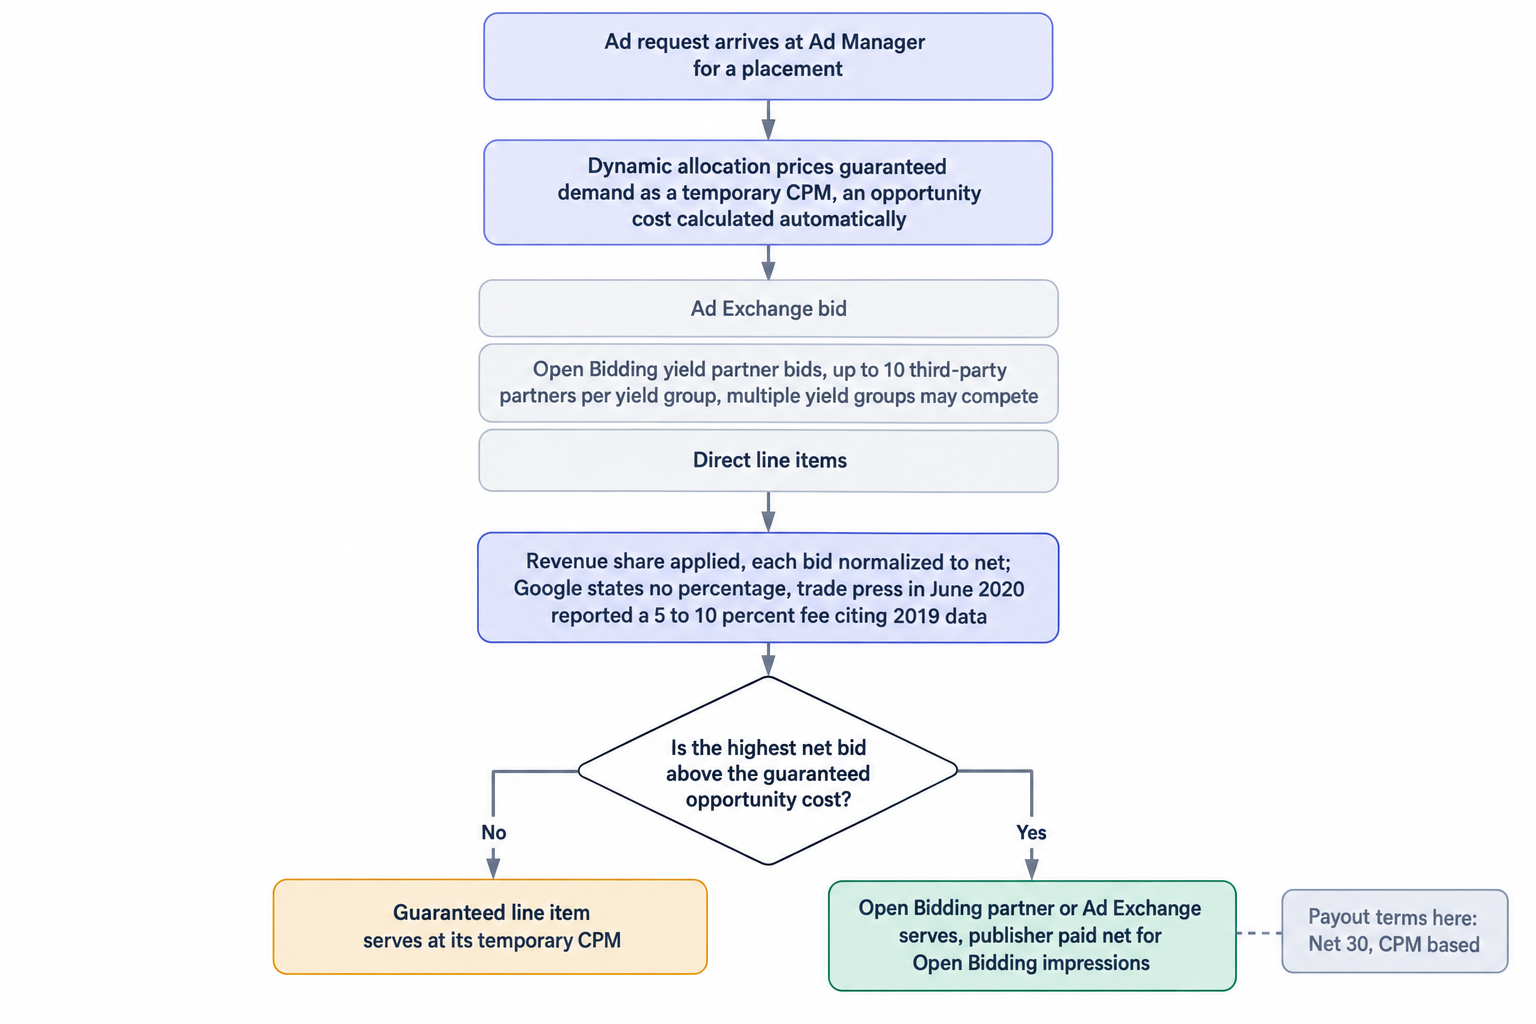
Guaranteed campaigns do not merely occupy the ad server, they price it. Dynamic allocation prices guaranteed demand through a temporary CPM, an opportunity cost calculated automatically, and open auction or remnant demand serves when it pays more than that opportunity cost. Every direct line item therefore behaves like a reserve price on the impressions it could have taken.
Two consequences follow. A programmatic win is only a win relative to the direct demand it displaced, so you need the opportunity cost per placement, per geo, and per device before you can call any Ad Exchange revenue incremental. And a misconfigured line item, say a roadblock at the wrong priority or a frequency cap set too tight, quietly lowers the opportunity cost and releases impressions to open auction at prices your direct advertiser would have beaten.
The check is concrete: compare Ad Exchange request eCPM against delivered direct CPM on the same placement, sliced by hour and device. Where the gap runs thin, your direct campaigns underdeliver against their own value, and the fix is trafficking, not pricing. Where request eCPM sits well above delivered direct CPM, either your rate card is stale or the placement's programmatic demand is stronger than your direct pricing assumes, and both cases deserve action.
First price changed what a floor does
In 2019 Google moved the Ad Exchange auction to first price and shipped unified pricing rules so publishers could manage floor prices across all non-guaranteed partners, with an initial limit of 100 rules. Before the transition a floor mostly filtered noise. After it, floors set the clearing price, because first-price buyers shade bids below their true willingness to pay, and your floor is the one lever that moves what the winner actually pays.
Bid shading also changes what a test means. Raise or lower one floor at a time, keep a control placement, and measure net revenue per thousand requests rather than impression CPM, because a floor that lifts CPM while collapsing win rate can still lose money. Track three numbers together after every change: win rate, request eCPM, and fill. A floor move that raises request eCPM while fill holds is a clean win; lock it in and stop iterating until the next cycle.
The same logic runs one layer down in our stack. Our auction ranks bids by expected value, using first price with bid shading, reserve prices, and goal-based pacing, and how our auction ranks bids determines each seat's clearing price before Google's stack ever sees the impression. Keep one floor ledger per placement across both layers, because a reserve price set at the seat and a unified pricing rule set above it will fight each other when nobody reconciles them.
Yield groups cap competition by configuration
Yield groups specify what inventory to sell with Ad Exchange, Open Bidding, or mediation for mobile apps. A single yield group takes up to 10 third-party yield partners, and multiple yield groups, with their own partners, can compete for the same inventory. That configuration ceiling matters more than most publishers assume: a yield group listing four partners caps competition at four, regardless of how many seats would bid if invited.
Audit the configuration quarterly. Count partners per yield group against the cap of 10, then check which of them returned bids in the last week, because a listed seat that times out contributes latency and nothing else. Remove partners that wrap the same supply path twice, since duplicate bids add timeout budget without adding price discovery. Split yield groups by format and geography rather than lumping inventory together, because video partners bid badly on display placements and vice versa, and per-group splits let each partner compete where it actually performs.
The unified auction and what it costs
Open Bidding runs a unified auction comparing yield partner bids, the Ad Exchange bid, and direct line items through dynamic allocation. The highest net bid, accounting for Ad Manager's revenue share, wins. Payments for Open Bidding impressions are made net of that share, so the auction normalizes gross bids down to comparable net values before it ranks them.
Google's help pages state no percentage for that share. Trade press reported in June 2020 that Open Bidding charges a fee of 5 to 10 percent, citing 2019 data, and we treat that figure as dated reporting rather than a current rate card. Run the arithmetic on your own delivery anyway: a partner bidding 2.00 gross through Open Bidding nets you between 1.80 and 1.90 under the reported range, and a header partner bidding 1.95 gross with no platform fee beats both. That comparison only works when you track bids net, which is one more way impression-level CPM reports mislead.
Stack choice follows from the same math. Header bidding through Prebid keeps platform fees off the bid but puts timeout budget and code maintenance on your page. Server-side demand moves that latency off the page at some cost in visibility into partner behavior. We integrate OpenRTB 2.6 seats and Prebid for both header and server-side demand, and at OnlyMedia we run Google Ad Manager, Ad Exchange, and MCM for our publisher partners, so we watch both paths clear the same inventory every day. Desktop display usually tolerates header latency well, video and mobile app inventory tend to perform better server-side, and a property past a million monthly pageviews generally needs both to keep request eCPM flat across devices.
The buyer side takes its share before you see the bid
Auction mechanics explain half your yield. The demand chain explains the rest. Google disclosed in 2019 that publishers kept over 69 percent of revenue when display ads were bought through Google Ads or DV360, and DV360's standard advertiser-side rate is 15 percent. The bid that reaches your auction has already lost 15 percent to the DSP before dynamic allocation, any network cut, or any Open Bidding revenue share touches it.
You cannot recover the buyer side's fees, but you can price around them. Demand that arrives net of buyer-side fees bids conservatively, which is precisely why bid shading exists and why floors, not impression volume, are the lever that moves your revenue. On our side of the table the arithmetic is flatter: we are an ad network, an SSP, and an agency in one company, we work with thousands of publishers, each above one million monthly pageviews, and we pay Net 30, CPM based, through our curated programmatic demand network. When a partner's fee sits inside the CPM rather than on top of it, your only reconciliation job is confirming that the invoice matches delivery, which is an hour, not a negotiation.
Instrument to a ten-minute heartbeat
Yield management dies without cadence. A daily export tells you yesterday's average, which is enough to notice a disaster and too late to catch anything else. Our reporting console refreshed every ten minutes tracks CPM, fill rate, ad requests, pageviews, revenue, countries, devices, and video detail, with API access, and that refresh rate changes what you can act on. A broken placement stops bleeding within the hour. A traffic mix shift from a new referring site shows up before it distorts a full day of eCPM data. A floor change reveals its effect on win rate and request eCPM the same morning.
Wire the API into your own dashboards and alert on three deltas: fill rate dropping faster than request volume grows, request eCPM falling while pageviews hold, and any single country spiking in requests without matching pageview growth. The three patterns indicate different failure modes, respectively a partner outage, a demand-side softening, and suspicious traffic, and each demands a different first response.
The routine that holds it together
Tools do not manage yield, a schedule does. This is the loop we run on publisher inventory, and it works equally well as a checklist for an in-house team:
- Daily: fill rate and request eCPM per key placement against the same hour last week; revenue pacing against the monthly goal; country and device mix scanned for anomalies.
- Weekly: one floor test across the top three placements; a yield group audit listing which seats bid and which timed out; the Ad Exchange match rate trend on your largest placements.
- Monthly: net versus gross reconciliation across every demand path; pruning of unified pricing rules toward the 100 rule budget, deleting rules that no longer match anything; a layout review of slot count per template against revenue per pageview.
The loop compounds because each layer feeds the next. The daily watch tells you when a floor test is worth running, the weekly tests tell the monthly reconciliation where to dig, and the monthly fee audit tells you which partners deserve seats in the next yield group revision. Teams that skip the cadence end up running all three checks in a panic after revenue drops, which is basic tracking with extra steps.
What agencies should audit first
Agencies advising publishers on yield should request four artifacts before anything else: a per-placement fill rate and request eCPM export, the yield group configuration with the partner list per group, the unified pricing rule inventory against the 100 rule limit, and a net versus gross fee table across every demand path. If a publisher cannot produce all four within a day, the diagnosis is usually instrumentation, not demand. Fix the measurement, then re-baseline, because every recommendation made against impression CPM alone will misprice the inventory.
What good looks like
You have moved beyond basic CPM tracking when four things hold. Your per-request economics, not your average CPM, drive placement decisions. Your floors carry a documented test history with win rate and fill attached. Your yield groups run near their partner cap with seats that actually bid. And your fee table shows every demand path net, from DSP take rates through platform revenue shares to your final payout. Properties that reach this state usually find the next gain in configuration, a partner added, a group split, a floor nudged, rather than in traffic.
If you want a read on where your inventory stands before changing anything, request a revenue estimate by email. Bring placement counts, monthly pageviews, and your current blended CPM, and compare the estimate against your own per-request numbers.